

- Mark Guzdial
- http://guzdial.engin.umich.edu
- Professor
- Creating Adoptable Computing Education Integrated into Social Studies Classes
- https://guzdial.engin.umich.edu/cs4dl/
- University of Michigan
- Bahare Naimipour
- Graduate Student Research Assistant
- Creating Adoptable Computing Education Integrated into Social Studies Classes
- https://guzdial.engin.umich.edu/cs4dl/
- University of Michigan
Creating Adoptable Computing Education Integrated into Social Studies Classes
NSF Awards: 2030919
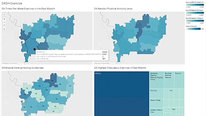
Standards for social studies classes in the United States are increasingly emphasizing the development of data literacy, that is the ability to read, analyze, interpret, evaluate, and argue with data and data visualizations. K-8 students are expected to be able to create and use timelines and maps in most states. High school students are expected to be able to interpret and argue with graphs and charts. While this is a challenge for social studies teachers, few of whom have had any professional development with data literacy, it is an opportunity for computing education. Inquiry-based learning around data literacy requires computing — flexible computing skills that students can use to manipulate and visualize data. We are creating purpose-built data visualization tools for use in social studies classes, using an iterative, participatory design process involving dozens of social studies teachers already. The main research questions of our three year project are (1) how to design and create task-specific programming environments that support learning data literacy and computing skills and concepts and (2) how to promote adoption of these tools by social studies teachers. We will be following a group of pre-service social studies teachers who use our tools in their data literacy course, as they move into their field experiences and first practicing teaching positions.
Creating Adoptable Computing Education Integrated into Social Studies Classes
NSF Awards: 2030919
Standards for social studies classes in the United States are increasingly emphasizing the development of data literacy, that is the ability to read, analyze, interpret, evaluate, and argue with data and data visualizations. K-8 students are expected to be able to create and use timelines and maps in most states. High school students are expected to be able to interpret and argue with graphs and charts. While this is a challenge for social studies teachers, few of whom have had any professional development with data literacy, it is an opportunity for computing education. Inquiry-based learning around data literacy requires computing — flexible computing skills that students can use to manipulate and visualize data. We are creating purpose-built data visualization tools for use in social studies classes, using an iterative, participatory design process involving dozens of social studies teachers already. The main research questions of our three year project are (1) how to design and create task-specific programming environments that support learning data literacy and computing skills and concepts and (2) how to promote adoption of these tools by social studies teachers. We will be following a group of pre-service social studies teachers who use our tools in their data literacy course, as they move into their field experiences and first practicing teaching positions.
-
 Fearless Integration: Culturally Relevant CS in K5 Education
Anita Crowder
-
 UDL4CS: A research practice partnership
Maya Israel
-
 Elementary Computing for All
Miranda Parker
-
 CS for All Teachers: You Are Not Alone
Melissa Rasberry
-
 Data Visualization with Community Partners
Michelle Friend
-
 Wind River Elementary Computer Science Collaborative
Karen Melara
2478 Views
Continue the discussion of this presentation on the Multiplex. Go to Multiplex
2478 Views
presentation
has been viewed
Related videos you might be interested in...
-
Fearless Integration: Culturally Relevant CS in K5 Education
Anita Crowder
-
UDL4CS: A research practice partnership
Maya Israel
-
Elementary Computing for All
Miranda Parker
-
CS for All Teachers: You Are Not Alone
Melissa Rasberry
-
Data Visualization with Community Partners
Michelle Friend
-
Wind River Elementary Computer Science Collaborative
Karen Melara
Mark Guzdial
Professor
Thanks for visiting our video! You can find Dr. Tammy Shreiner's on-line education research for data literacy in social studies here which links to our tools. You can play with our prototype data visualization tool here. The project webpage is available here.
If you know social studies teachers who might want to work with us in participatory design sessions to build more and better tools to integrate computing into social studies, please be in touch! We have a mailing list sign-up form here.
We welcome your questions and advice about our project. In particular, we are always for good exemplars of computing in social studies. Thanks!
Kirstin Milks
Rosio Bugarin Pedroso
Renee Fall
HI Mark and Bahare:
Computing in the service of social science! What a great project with such potential for social studies teachers and students. One exemplar to share: the Mapping Prejudice project in Minnesota, which uses digital tools (mapping and time visualizations) to uncover structural racism (growth of racial restrictions to property ownership over the 20th century) (educator guide). Thanks for sharing your work!
Mark Guzdial
Rosio Bugarin Pedroso
Mark Guzdial
Professor
Thanks, Renee! Our collaborator, Tammy Shreiner, is interested in moving the project into more of a focus on critical data literacy, so the Mapping Prejudice project is a great lead. Thanks!
Rosio Bugarin Pedroso
Sarah Haavind
Senior Research Project Manager
Mark and Bahare! Interesting project, and as Renee points out, so useful for examining current events focusing on critical data literacy. It makes me curious about the sorts of investigations that the teachers you are already working with have brought to the tool. What are they investigating? What questions are they asking? Appreciate your sharing your project with us!
~Sarah
Mark Guzdial
Rosio Bugarin Pedroso
Mark Guzdial
Professor
Thanks, Sarah! Too early to tell with DV4L. Especially during the pandemic, the social studies teachers we're working with are just starting to incorporate the new data literacy goals into their social studies curricula. Bahare is now working with a few teachers who are developing lesson plans for data literacy using tools. One theme we're seeing: Teachers try out new curricula first on the topics that they're most excited about.
- Mark
Kirstin Milks
Rosio Bugarin Pedroso
Kirstin Milks
Science Teacher
Hi DV4L team! Amplifying Sarah's comment above, I am excited by and impressed with how this tool can scaffold data literacy in history for both students and teachers -- and would love to know what kinds of questions and investigations and lessons your tool's been used for already by your social studies teachers. Like Tammy and Renee, I am also thinking about how this tool could be used for critical data literacy, especially right now.
I'm a high school science teacher who trained as a scientist before my career in the classroom, and I'm curious about how teachers with history trainings might have different conceptions of data literacy or representations of data than someone who works in or teaches STEM. Do your experiences show any salient differences, or scaffolds that have been particularly high-leverage for your teacher-learners?
Mark Guzdial
Rosio Bugarin Pedroso
Mark Guzdial
Professor
Hi Kirstin,
We could go on for hours about how we scaffold our social studies teachers -- it's something that we think about a lot. For example, we use minimal manuals to guide use with the tools that we include as design probes. We structure our participatory design sessions so that everyone gets something working (a visualization appears) within 10 minutes, everybody tries something new (some flexibility in outcomes), and we provide suggested paths for a few more things to explore. We haven't contrasted with STEM teachers, but Tammy has a quote that I love: Most people don't become a history teacher because they love numbers, data, and computers. History teachers are more drawn to narrative and context. So, the focus in developing and using visualizations are different than in STEM courses.
- Mark
Kirstin Milks
Rosio Bugarin Pedroso
Satabdi Basu
Joan Freese
Hi,
Could you share a little more about the state standards for data literacy/data visualizations? Are these math standards or are they found in other content areas such as history as well? Also, what tech skills do users need to work with D4VL?
Thanks!
Mark Guzdial
Rosio Bugarin Pedroso
Mark Guzdial
Professor
Hi Joan,
The co-lead on the project, Tammy Shreiner, has published a journal article tracking data literacy standards in all 50 states: https://www.emerald.com/insight/content/doi/10.1108/ILS-03-2020-0054/full/html
- Mark
Kirstin Milks
Bahare Naimipour
Graduate Student Research Assistant
Hi Joan, DV4L does not require any tech skills to work with, thanks for asking!
-Bahare
Rosio Bugarin Pedroso
Principal
Hi DV4L Team, What an incredible program. I was an elementary teacher and my sister is currently a social studies teacher. She often shares how difficult it is to incorporate and teach data standards. Would love to know more about what specific take-aways or lessons learned you found in regards to creating an app with teachers and students in mind.
Mark Guzdial
Mark Guzdial
Professor
Hi Rosio,
Thank you! We just published a paper at SITE 2021 on our latest findings from our participatory design sessions -- see blog post here. One lesson is about the need for good user-centered design. Social studies teachers don't want to spend their time teaching a tool. So, by making task-specific tools, we create things that are easier to adopt and use.
- Mark
Kirstin Milks
Joshua Danish
Hi all,
This looks awesome! I was wondering if you could share more about how you'll be integrating programming in down the road?
Thanks!
Mark Guzdial
Professor
Thanks! We think that we are integrating programming. What would you call integrating programming?
- Mark
Joshua Danish
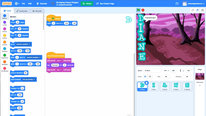
Fair question. Well, I may also have misunderstood. In the video, you showed teachers writing code (JavaScript?) but then note that they were worried about getting it right and show the final tool which appeared to be a mix of dropdown menus to select the axis and I inferred no more Javascript required. So I inferred they were just making choices using those menus and not necessarily programming? So I'd say that that is certainly tied to all sorts of great CS / computational ideas, but would have assumed it might not be viewed as programming without more control / power? I think it's great either way, but as I think about some of my own projects and how they are similar or different, I was hoping to see how you were tackling that part and it's fit with CS ... expectations?
Mark Guzdial
Professor
The code is a JSON object -- it's based on the way that Vega-Lite expresses code. The video mostly focuses on DV4L. You can see both versions in this blog post. http://historyindata.org/dv4l/ is the base version, where code is only visible when you click on a saved graph. http://historyindata.org/dv4l/scripting/ is the scripting version where you can edit the JSON or use the pull-down menus. The menus update the script, and vice-versa. Both will generate the graph. This is our scaffolding to ease into programming.
We're not putting all our eggs into the one basket. We're working on additional tools where programming is more visible. We're developing all of these in a participatory design process, so we create prototypes (low-fidelity and high-fidelity) as design probes for our co-designers and design informants. Here's a video that we created for a group of teachers we're working with this week. This one is for a slow construct graph tool, where code is more visible and editable.
Overall, I see this as design-based research using the technology of task-specific programming languages. One of the variables we vary is how much the programming language looks like a traditional text language versus more domain-relevant representations, like matrices for pre-calculus. We're exploring different degrees to how central programming is to the activity.
Kirstin Milks
Joshua Danish
Very cool!! That's really interesting. I appreciate you elaborating and will be diving in now!
Mark Guzdial
Anita Crowder
This is an amazing project. I really appreciate that social studies teachers themselves were the drivers of the design of the software. I realize that it has been built for and by social studies teachers, but I can see how this could be effectively used in many other content areas. Thank you for sharing your work!
Mark Guzdial
Susan Warshaw
I like the idea of integrating data literacy into the the social studies curriculum. I am hoping that the program includes some background on how to tell data stories and also how to design effective (not just pretty) graphics.
Mark Guzdial
Mark Guzdial
Professor
Thanks, Susan. I'm learning a lot about history education in this project. For the teachers we're working with, everything starts with stories, and the data only comes in if the teachers can figure out how it enhances the story. They're not at all interested in data that doesn't connect to the stories (narrative and context) that they're communicating.
Kirstin Milks
Kirstin Milks
Science Teacher
Hey DV4L team! Circling back to let you know I keep thinking about your project -- that I keep thinking about how the stories are also what science teachers are after, but how the scale of stories -- or cast of characters -- might feel different. Lots to think about, and I thank you heartily for that. Excited to see what you continue to learn from teachers who use your tools!
Mark Guzdial
Mark Guzdial
Professor
Thanks, Kristin! We've been thinking about the roles that data visualization can play in connecting students with challenging and difficult stories, like genocide and racism. Tammy Shreiner is eager to move our project towards critical data literacy.
Josephine Louie
Hi DV4L team--
It's great to learn about your work! Our project is very similar - we have designed prototype curriculum modules with mathematics and social studies for use in both settings, but have been testing primarily in non-AP high school mathematics classes for our research. Our focus is promoting student interest and learning of statistical thinking and data analysis skills, and we start with driving questions that raise social justice questions and help students understand social and economic conditions in the U.S. currently and over time. What datasets are you using with teachers? What types of learning or affective outcomes are you hoping to influence and measure among teachers and/or students?
Mark Guzdial
Professor
Hi Josephine,
Thanks for coming by! We're mostly using data from Our World In Data, Data.gov, and the United Nations. I'd love to hear what works for you to get social studies to engage with the computing-based modules. Our focus isn't classroom implementation yet. Rather, we're focusing on iterative participatory design so that we have tools that social studies want to adopt. Even though data literacy is part of social studies standards in most states, few teachers we have found actively use computational tools for any of those learning goals.
In terms of learning outcomes, it's the social studies standards first. We want to help teachers achieve their goals. Secondly, affective outcomes about computing -- increasing self-efficacy around computing. Third, we hope to achieve learning outcomes around computing aligned with the earliest stages of the Everyday Computing learning objectives, e.g., recognizing that programs are deterministic, that changing the order of lines might or might not change the outcome, and that programs are exacting in syntax.